0 votes
146 views
asked in Engg-aptitude by (215k points)
edited by

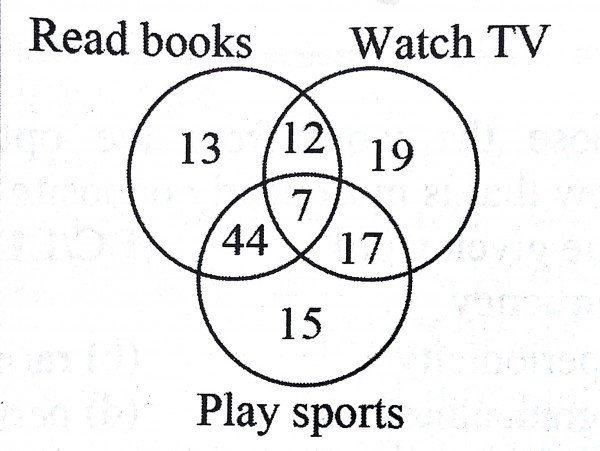
The Venn diagram shows the preference of the student population for leisure activities.       

From the data given, the number of students, who like to read books or play sports is _______

      (a) 44                                                                  (b) 51

      (c) 79                                                                  (d) 108

Please log in or register to answer this question.

Welcome to Q&A discussion forum, where you can ask questions and receive answers from other members of the community.

10.4k questions

274 answers

26 comments

14.5k users

...